

Chris Jones takes you through how to navigate your Organisation Dashboard on Clientshare Pulse.
Transcript:
Chris: As an owner of your organisation, you’ll have access to the Organisation Dashboard.
This dashboard displays data across all workspaces and clients, and it is only available to users with owner-level access. To view it, simply select the "All workspaces" and "All clients" options from the dropdown menus.
At the top of the dashboard, you’ll find key indicators that reflect data across your entire organisation. These include the total number of licences, the number of reviews sent to those licences, and combined average scores for NPS (Net Promoter Score) and the Pulse Index. These averages are calculated across all your workspaces.
You can use filters to tailor the data shown. Filters are available for both account managers and clients—just tick the boxes to select the relevant ones. Once you've set your filters, you can save them and find them again under "Recently used filters" at the bottom of the filter section.
There’s also the option to select the time period you want to review data for. This could be the last 3, 6 or 12 months, or any custom timeframe you choose.
Below that, there’s a list of your clients sorted by their highest Pulse Index score. For each client, you’ll see:
- The client name (clickable to navigate directly to their details)
- The number of reviews sent
- The date of the last review and a list of previous ones
- The number of recipients who received the review
- The percentage of reviews that have been read
- The client’s Pulse Index score and average NPS score
Further down, you’ll find your scorecards. These show Pulse Index scoring by client and by account manager, aggregated across the whole organisation. You can hover over each dot on the chart to see which score belongs to which client.
In addition, the dashboard displays the average Pulse Index and Net Promoter Score across your organisation, along with a Satisfaction Score based on your CSAT questions.
At the bottom, there’s a tally of the overall satisfaction rating across your organisation. By hovering over the star ratings, you can see the exact score behind each.
Finally, you’ll see a section for recent feedback comments from across all workspaces and clients. Once you’ve acknowledged and dealt with a comment, you can select "Mark as completed" to keep your dashboard tidy.
If you have any questions about the Organisation Dashboard, please contact support@myclientshare.com or use the chat function in the bottom right corner of your screen.
Thanks for listening!
Read more:

How to set up Automations

How to effectively combine NPS with your QBRs
.jpg?width=300&height=225&name=in-the-news-clientshares-qbr-used-by-1-in-2-ftse-100-blog-thumbnail%20(1).jpg)
Clientshare's QBR used by 1-in-2 FTSE 100
Not yet a Clientshare customer?
Learn more about Clientshare and our software solutions for service providers here or request a demo.
Download our latest whitepaper
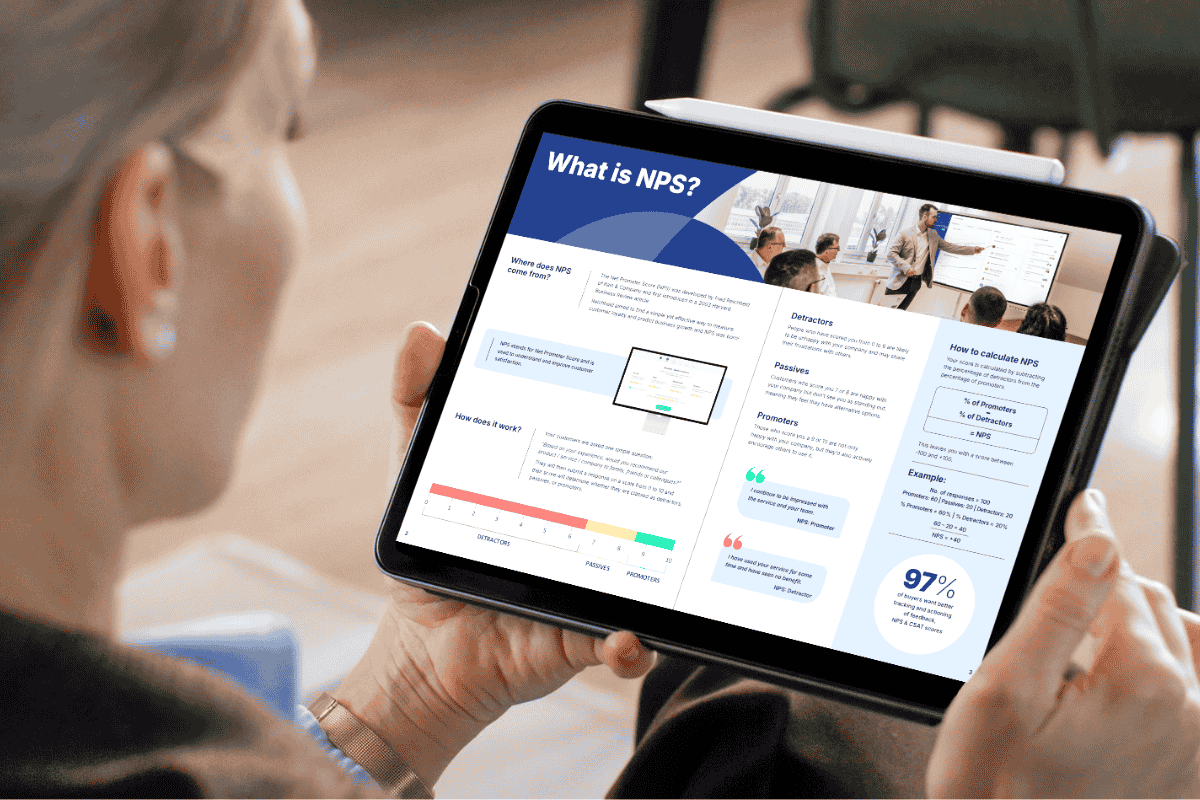
Net Promoter Score (NPS) remains one of the most widely used customer feedback metrics in the B2B world. Many organisations send out annual surveys or ad-hock feedback requests, but few know how to use NPS to retain clients and drive growth effectively.
In this paper, we explain what NPS measures, why it's important, and explore the ways leading suppliers are using it to improve contract retention, drive upselling opportunities and boost overall customer experience.